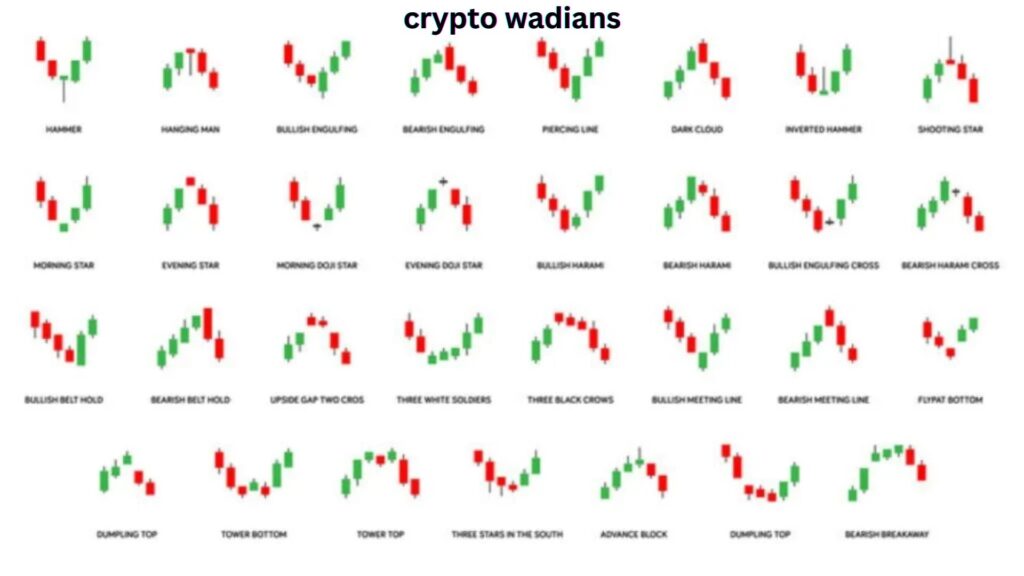
Candlestick Chart Patterns in Crypto Trading
Trading cryptocurrencies can be very profitable, but navigating the constantly shifting market takes expertise and understanding. Candlestick patterns are one instrument that traders frequently use. These patterns can be used to forecast future price fluctuations and offer insightful information about market trends. We will go deeper into the realm of candlestick patterns and examine their importance in cryptocurrency trading in this article.
Understanding the Basics of Candlestick Patterns
For generations, traders have employed candlestick charts, sometimes referred to as Japanese candlestick charts. This charting system’s original application was in 18th-century Japan, when it was utilized to examine changes in rice prices. These days, a lot of different financial markets, including cryptocurrency exchanges, follow candlestick patterns.
Two wicks, or shadows, one extending above and one below the rectangular body make up a candlestick. The wicks show the highest and lowest price reached during that time period, while the body shows the price range between the opening and closing of that specific time period. Through an analysis of the candlesticks’ form and hue, traders can obtain significant insights about the sentiment of the market.
Why and How Candlestick Patterns Started
In the seventeenth century, rice dealers in Japan developed candlestick patterns as a means of forecasting future market moves. The link between supply and demand was initially observed by the well-known Japanese rice trader Homma Munehisa, who also devised a technique for visualizing it with candlesticks.
The American trader Steve Nison later improved and popularized Homma’s methods in his book “Japanese Candlestick Charting Techniques.” Candlestick charts were first popularized in the West thanks to Nison’s work, and their capacity to offer insightful analysis of market movements led to its rapid acceptance.

Types of Candlestick Patterns in Crypto Trading
Candlestick patterns come in a variety of forms that traders need to know about. These patterns fall into three categories: triple, dual, and single candlestick patterns. Let’s take a closer look at each category.
Single Candlestick Patterns
A single candle can create a single candlestick pattern, which can reveal important information about the mood of the market. Typical single candlestick patterns include the following:
- The Hammer pattern, following a downward trend, suggests a possible trend reversal.
- The Hanging Man pattern indicates that an uptrend may be followed by a possible trend reversal.
- The Doji pattern, which appears when the starting and closing prices are almost identical, denotes market hesitation.
Traders can make wise trading decisions and obtain important insights into market mood by identifying these patterns.
Dual Candlestick Patterns
Two consecutive candles make up a dual candlestick pattern, which can reveal information about impending market reversals. Typical dual candlestick patterns include the following:
- A possible trend reversal is indicated by the Bullish Engulfing pattern, which happens when a smaller bearish candle is followed by a larger bullish candle.
- The reverse of the bullish engulfing pattern, the bearish engulfing pattern, indicates a possible trend reversal from bullish to bearish.
Traders can predict possible trend reversals and modify their trading methods accordingly by comprehending these patterns.
Triple Candlestick Patterns
Three consecutive candles make up a triple candlestick pattern, which might reveal possible market reversals. Typical triple candlestick patterns include the following:
- A lengthy bearish candle, a little bullish or bearish candle, and a massive bullish candle combine to form the Morning Star pattern. A possible trend reversal from negative to bullish is indicated by this pattern.
- In contrast to the morning star pattern, the evening star pattern indicates a possible trend reversal from bullish to negative.
Traders can see possible reversals and seize market opportunities by identifying these patterns.
Candlestick Patterns
After discussing the many kinds of candlestick patterns, let’s examine some of the patterns that are most frequently seen in cryptocurrency trading.
The Bullish and Bearish Engulfing

A smaller bearish candle is followed by a larger bullish candle that entirely engulfs the preceding candle, creating the bullish engulfing pattern. A possible trend reversal from negative to bullish is indicated by this pattern.
On the other hand, a bigger bearish candle that fully engulfs the preceding candle follows a smaller bullish candle to form the bearish engulfing pattern. This pattern points to a possible bullish-to-bearish trend reversal.
The Hammer and Hanging Man

A lengthy lower shadow and a small body define the hammer design. It follows a downward trend and may indicate a trend reversal. A hammer pattern suggests that buyers are intervening and attempting to drive the price upward.
Like the hammer pattern, the hanging man pattern happens following an uptrend. It raises the possibility of a bullish to bearish trend reversal. A hanging man pattern suggests that sellers are beginning to put pressure on the price.
The Doji Patterns

When the opening and closing prices are almost identical, doji patterns arise. They can be an indication of impending trend reversals and market hesitation. Doji patterns can have bullish or bearish connotations based on their position and past market activity.
what is cryptocurrency
what is crypto wallet
Why is Crypto so Volatile
what is bitcoin
what is block chain


Pingback: What is FOMO in Trading? - cryptowadians.com